ConnectomeKG
Connectomes as knowledge graphs.
Eric G. Suchanek, PhD -- Flux-Frontiers
ConnectomeKG turns an electron-microscopy connectome into a queryable knowledge graph. Every neuron is a node, and every edge between two neurons carries a synapse count and a transmitter sign. Cell types, neuropils, taxonomy, hemilineages and community labels sit on top. The first corpus is the FlyWire FAFB v783 adult Drosophila brain: 139,255 neurons and 3,732,460 connected neuron pairs.
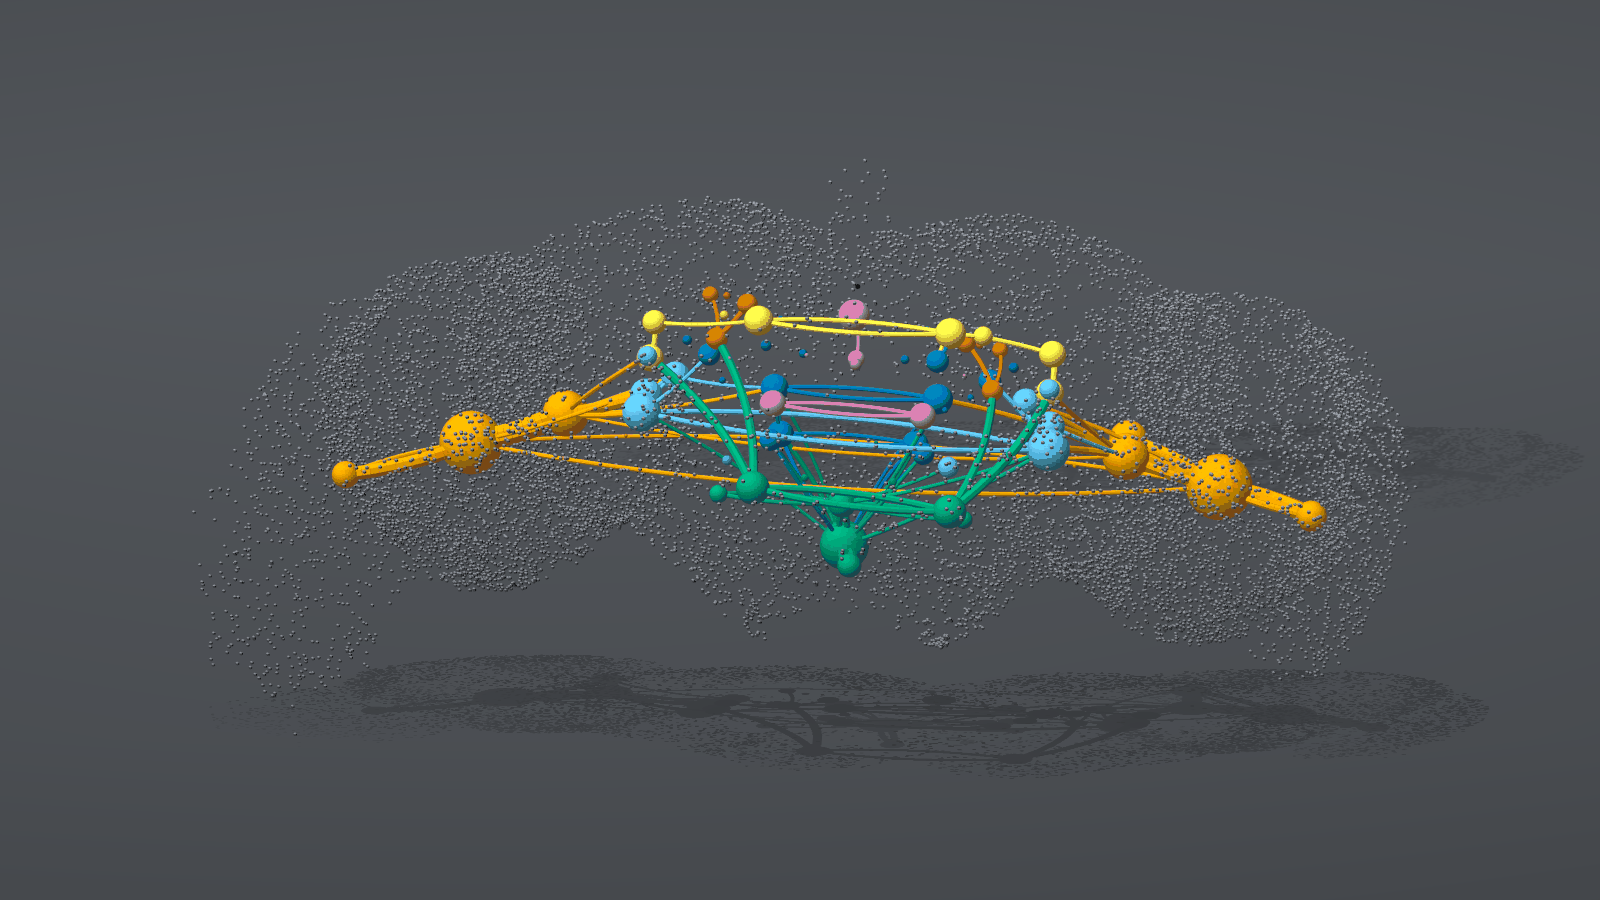
The whole fly brain, and where its signal goes. Each sphere is one of the 79 neuropils, placed at the synapse-weighted center of its neurons and colored by brain region -- orange for the optic lobes down each side, yellow for the superior neuropils and lateral horn across the top, green for the antennal lobe and the neuropils around the esophagus below, blue and light blue for the inferior, ventromedial and ventrolateral neuropils between them. A sphere's width grows with the cube root of its synapse count, so one twice as wide holds about eight times as many.
The tubes are the strongest 100 of 5,786 directed neuropil pairs. Thickness grows with the square root of the flow, and each tube bows to the right of its direction of travel, so a tube bulging toward you runs left to right. Flow is carried by neurons rather than counted from synapses: each neuron's output synapses in B, apportioned by the share of its input lying in A, summed over every neuron.
Behind them, one gray dot per neuron at its cell body -- all 139,255 of them, which is what gives the brain its outline. The floor and shadow carry no data; they are there for depth. One command draws it: connkg quilt --view flow --floor --cloud --still. Every mark is keyed in Reading the images.
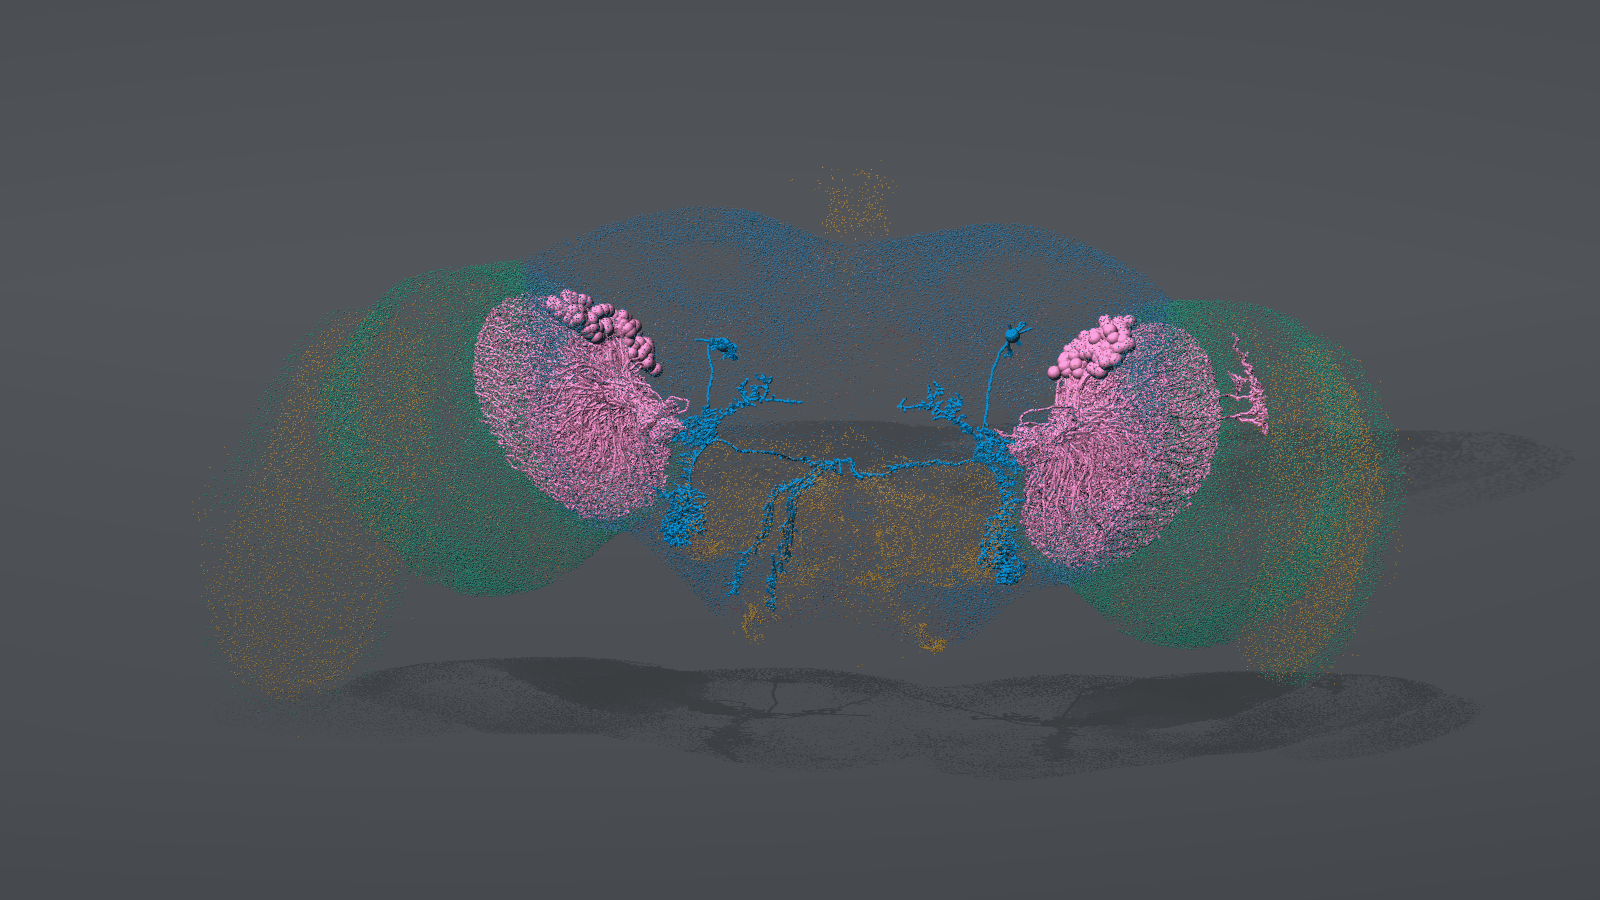
And one circuit inside it. Pink is LPLC2, the looming detectors filling the
lobula of each optic lobe; blue is DNp01, the giant fiber, which collects from
them and sends the two axons leaving the bottom of the frame down to the nerve
cord. One command draws it, over the same spec grammar the path and cone
queries take: connkg quilt LPLC2 DNp01 --tubes --cloud.
Data credit and license
The images above are renders of the FlyWire FAFB v783 connectome: Dorkenwald, S. et al. (2024), Nature 634, 124-138, and Schlegel, P. et al. (2024), Nature 634, 139-152. The data is licensed under CC BY-NC-SA 4.0. The render is an adaptation of it, shared under the same license, not under the software's Elastic License 2.0.
How it fits together
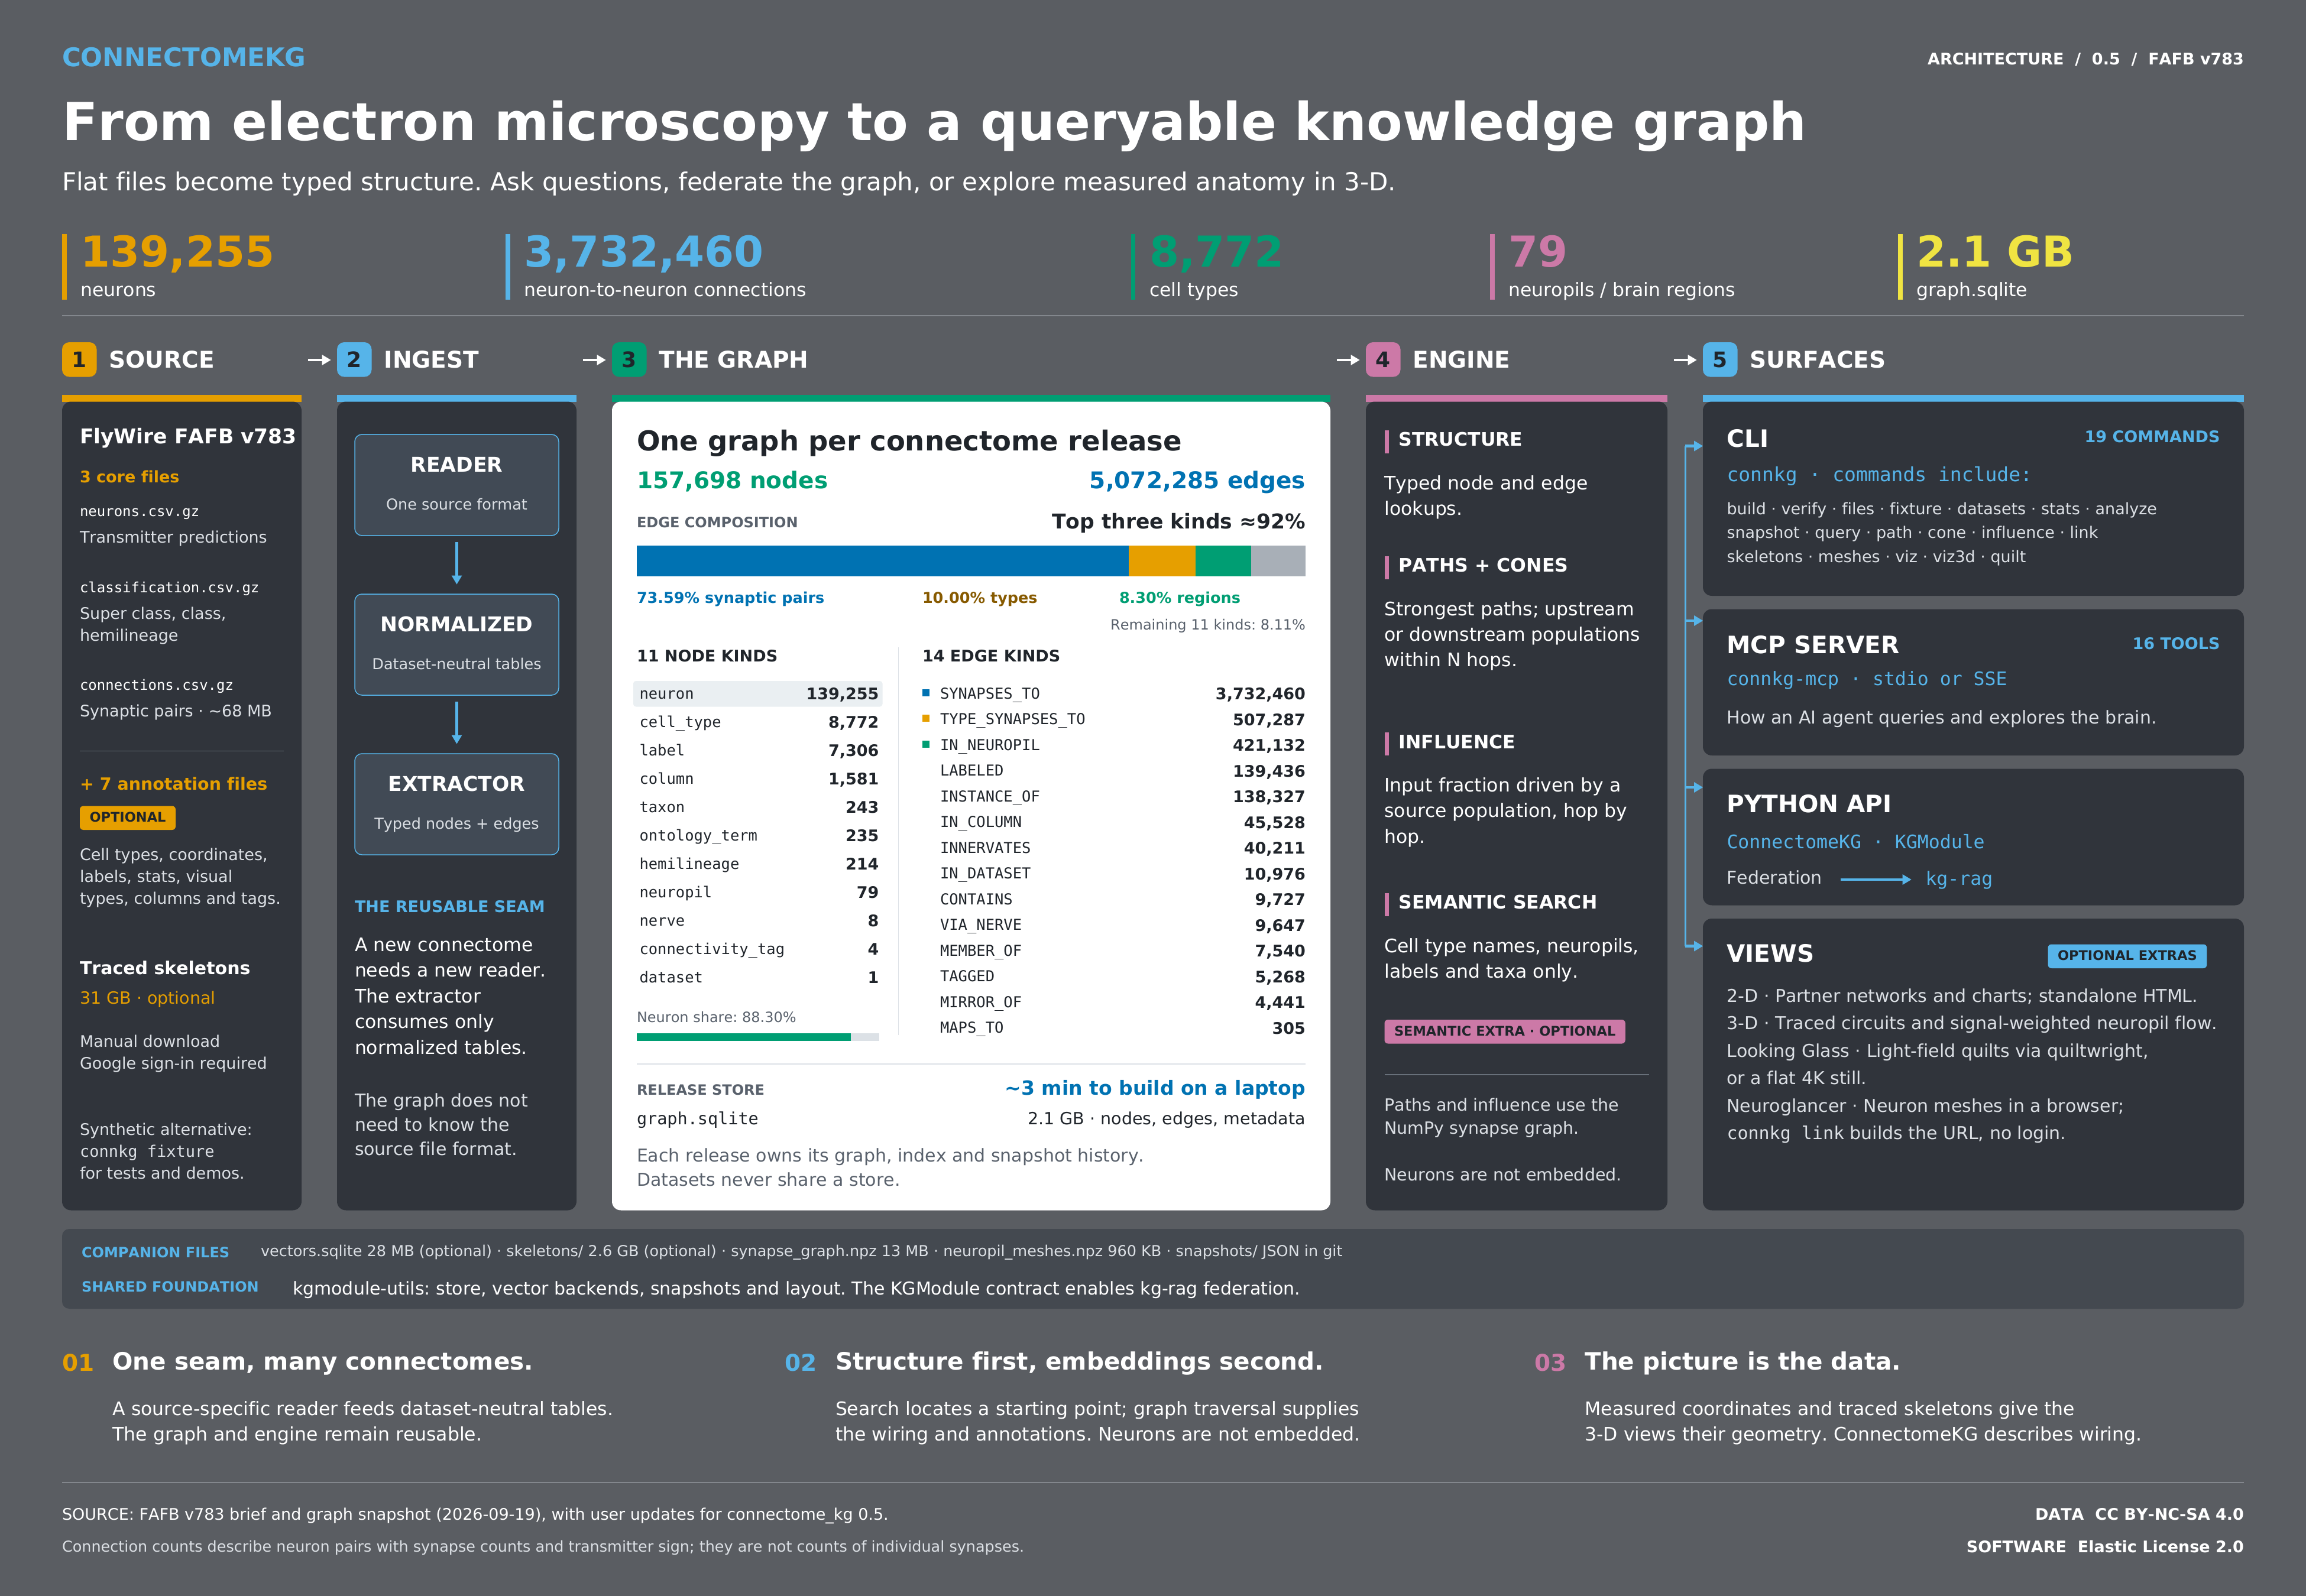
The whole system on one sheet: the FlyWire files that go in, the reader and normalized tables that make the graph reusable, what the graph holds, the queries over it, and the four ways out. Figures are from the built FAFB v783 graph. PDF.
Where to start
| page | covers |
|---|---|
| Get the data | The Codex files each of the three releases needs, and how to download and check them |
| Asking the graph a question | The SPEC grammar and the answer forms, then connkg path, cone, influence, query and link |
| What is in the graph | Node and edge kinds, transmitter signs, and the one-graph-per-connectome layout |
| Command reference | Every connkg command and connkg-mcp: options, defaults and an example each |
| Rendering the connectome in 3-D | connkg quilt and connkg viz3d: the circuit and flow views, how each is drawn, and Looking Glass quilts through quiltwright |
| Scene API | build_brain_scene, neuropil_flow and the rest of connectomekg.scene |
| Skeleton API | Reading, writing and simplifying SWC skeletons |
The README covers installation and the build.